OpsGuard: A Production-Ready Status Page with Modern DevOps Practices
From Code to Cloud: Building a Self-Healing Status Page on AWS EKS How I built an enterprise-grade infrastructure monitoring platform using Kubernetes, Terraform, and GitOps — from concept to deployment on AWS Introducti...
From Code to Cloud: Building a Self-Healing Status Page on AWS EKS
How I built an enterprise-grade infrastructure monitoring platform using Kubernetes, Terraform, and GitOps — from concept to deployment on AWS
Introduction: Why I Built OpsGuard
Every modern organization needs a way to communicate service health to their customers. When AWS, GitHub, or Cloudflare experience issues, they don’t leave users guessing — they have public status pages that provide real-time updates. But what if you could build your own?
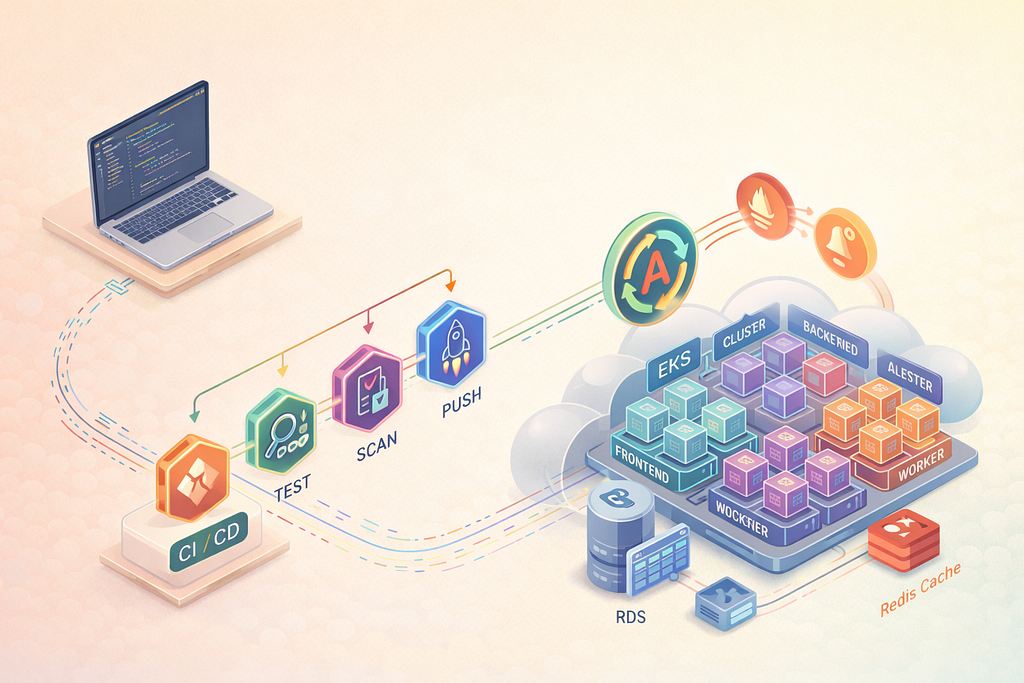
That’s exactly what I set out to do with OpsGuard — a self-hosted, production-ready status page that combines real-time infrastructure monitoring with automated incident management. More importantly, I wanted to build it using industry-standard DevOps practices that enterprises actually use in production.
This blog post walks through my journey of building OpsGuard, the architectural decisions I made, the challenges I faced, and how modern DevOps practices like GitOps, Infrastructure as Code (IaC), and DevSecOps came together to create a robust, scalable solution.
The Architecture: Designing for Scale and Reliability
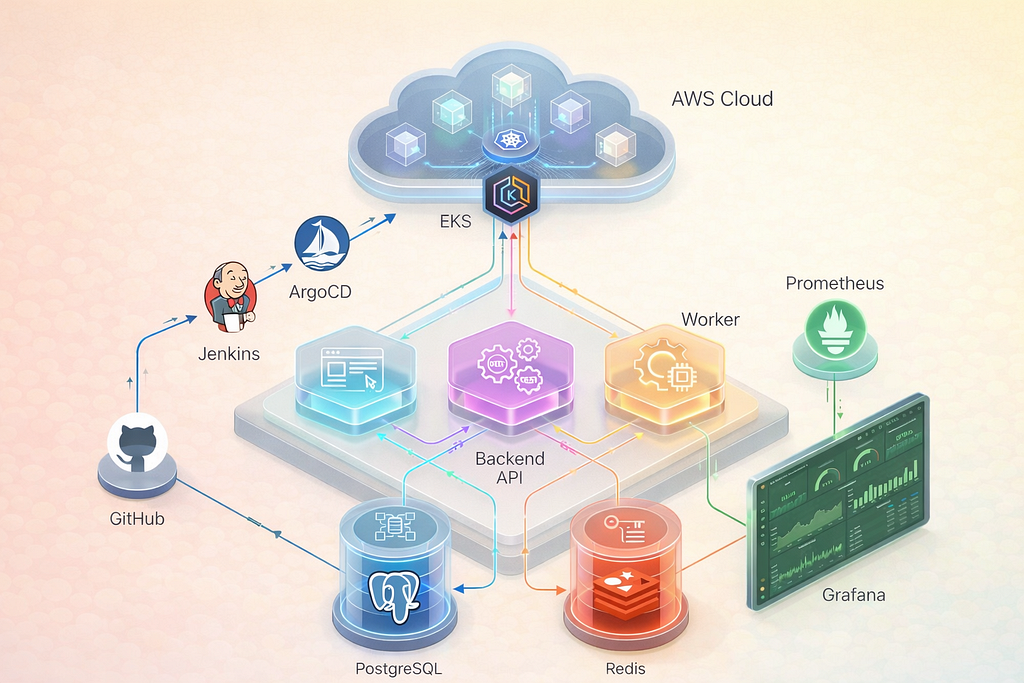
Before writing a single line of code, I spent considerable time designing an architecture that would be both scalable and maintainable. The key principle was separation of concerns — each component should do one thing well.
The Application Layer
The application consists of three main services:
1. Frontend (React + TypeScript): A responsive, real-time dashboard that displays service health, active incidents, and historical uptime metrics. Built with Vite for optimal performance.
2. Backend API (FastAPI + Python): The core REST API that handles all business logic, from processing health check results to managing incidents. FastAPI was chosen for its excellent async support and automatic OpenAPI documentation.
3. Worker Service: A background service that performs automated health checks every 30 seconds. It monitors configured endpoints and updates service status in real-time.
The Data Layer
For data persistence, I choose:
- PostgreSQL (Amazon RDS): For storing services, incidents, and historical data. RDS provides automatic backups, multi-AZ failover, and managed updates.
- Redis (ElastiCache): For caching frequently accessed data and managing real-time WebSocket connections.
Why Kubernetes?
Kubernetes might seem like overkill for a status page, but it provides critical capabilities:
- Self-healing: If a pod crashes, Kubernetes automatically restarts it
- Rolling updates: Zero-downtime deployments
- Horizontal Pod Autoscaler (HPA): Automatic scaling based on load
- Resource limits: Prevent any single service from consuming all resources
Infrastructure as Code: Reproducible Deployments with Terraform
One of my core principles was that infrastructure should be code. No clicking around in the AWS console — everything defined in Terraform.
module "eks" {
  source       = "./modules/eks"
  cluster_name = "opsguard-prod"
  subnet_ids   = module.vpc.private_subnet_ids
  # ... configuration
}
What Terraform Manages
My Terraform configuration provisions:
- VPC with public and private subnets across 3 availability zones
- EKS Cluster with managed node groups
- RDS PostgreSQL instance with encryption at rest
- ECR Repositories for container images
- Security Groups following least-privilege principles
- IAM Roles with minimal required permissions
The CI/CD Pipeline: From Code to Production
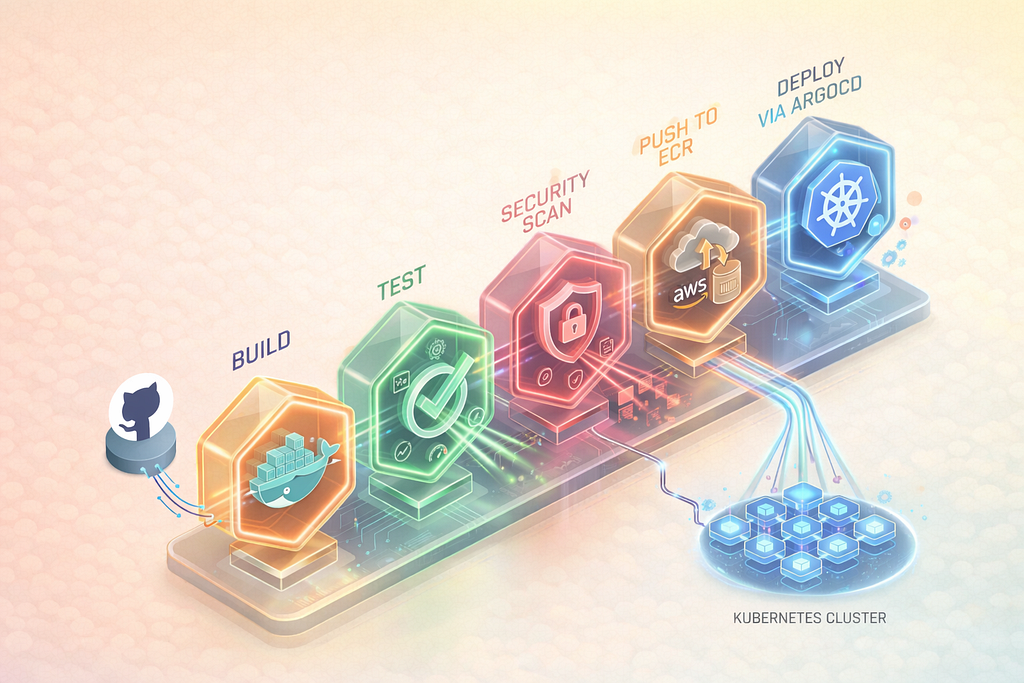
Every commit to the main branch triggers a comprehensive pipeline that builds, tests, scans, and deploys the application.
Pipeline Stages
1. Build: Docker images are built using multi-stage builds to minimize image size
2. Unit Tests: Pytest runs the test suite with coverage reporting
3. Security Scan (Bandit): Static analysis catches common Python security issues
4. Dependency Check (Safety): Identifies vulnerable dependencies
5. Container Scan (Trivy): Scans Docker images for CVEs
6. Push to ECR: Images are tagged and pushed to Amazon ECR
7. Deploy via ArgoCD: GitOps handles the actual deployment
DevSecOps: Security Built In, Not Bolted On
Security isn’t an afterthought — it’s integrated into every stage:
- Bandit catches hardcoded credentials and SQL injection vulnerabilities
- Safety alerts on vulnerable Python packages
- Trivy scans container images for known CVEs
- SonarQube provides code quality and security analysis
If any security check fails, the pipeline stops. No exceptions.
GitOps with ArgoCD: The Future of Deployments
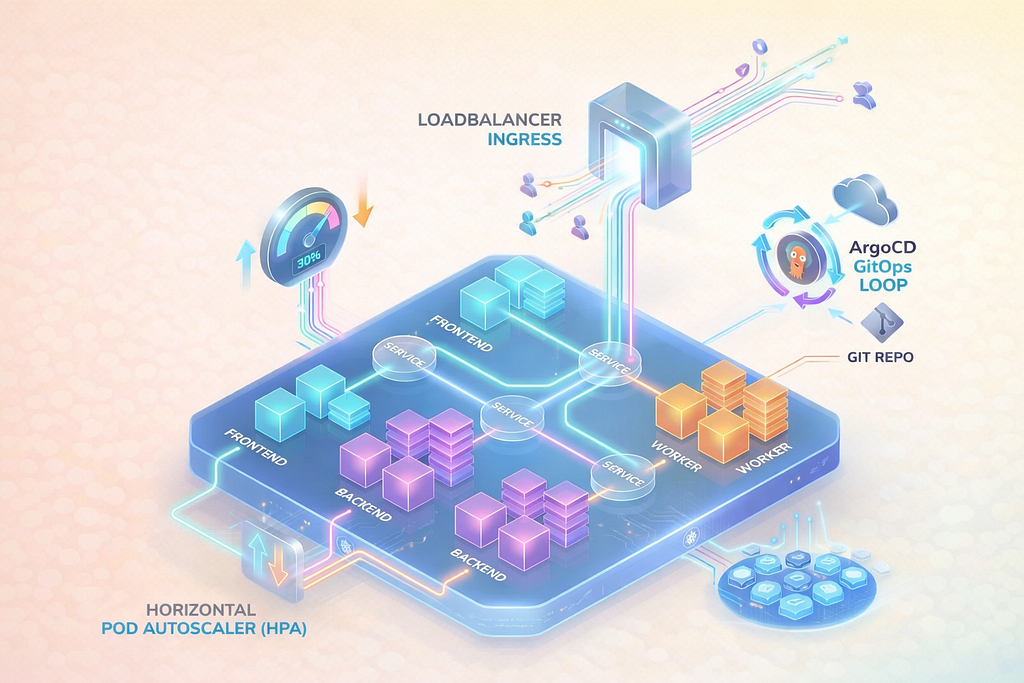
Traditional CI/CD pipelines push changes to production. GitOps flips this model — ArgoCD pulls the desired state from Git and ensures the cluster matches.
How It Works
1. The CI pipeline updates the image tag in the Kubernetes manifests
2. ArgoCD detects the change in the Git repository
3. ArgoCD applies the changes to the cluster
4. If someone manually changes something in the cluster, ArgoCD reverts it
This provides:
- Audit trail: Every change is a Git commit
- Easy rollbacks: `git revert` and ArgoCD handles the rest
- Drift detection: No more “configuration drift” in production
- Self-healing: The cluster always matches the Git repository
Observability: You Can’t Fix What You Can’t See
A production system without observability is flying blind. OpsGuard uses the industry-standard Prometheus + Grafana stack.
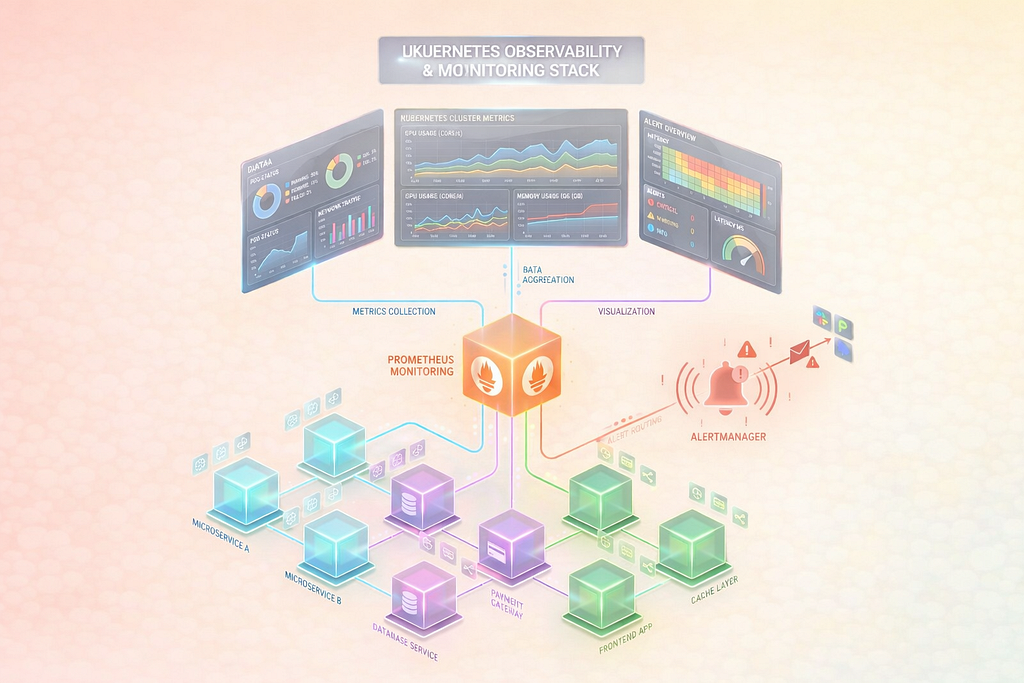
Metrics Collection
Prometheus scrapes metrics from every component:
- Application metrics: Request rates, latency percentiles, error rates
- Kubernetes metrics: Pod CPU/memory, node health, deployment status
- Custom metrics: Health check results, incident counts, uptime percentages
Dashboards and Alerts
Grafana provides pre-configured dashboards showing:
- Cluster resource utilization
- Application performance (RED metrics: Rate, Errors, Duration)
- OpsGuard-specific metrics (service status, uptime)
AlertManager routes critical alerts to Slack, email, or PagerDuty based on severity.
Container Security: Defense in Depth
Security at the container level required careful attention:
securityContext:
  runAsNonRoot: true
  readOnlyRootFilesystem: true
  allowPrivilegeEscalation: false
  capabilities:
    drop:
      - ALL
Key Security Measures
- Non-root containers: Containers run as unprivileged users
- Read-only filesystems: Prevents attackers from modifying binaries
- Dropped capabilities: Containers can’t perform privileged operations
- Resource limits: Prevents resource exhaustion attacks
- Network policies: Pods can only communicate with allowed services
Conclusion:
OpsGuard represents what’s possible when modern DevOps practices come together. Infrastructure as Code ensures reproducibility. CI/CD pipelines automate quality gates. GitOps provides declarative deployments. Observability enables proactive operations.
The project is open source on [GitHub](https://github.com/Bhagirath00/OpsGuard). Whether you’re building your own status page or learning DevOps practices, I hope OpsGuard serves as a useful reference.